![Location Matters: Geolocation and Data Science [Part 1]](https://res.cloudinary.com/rsmglobal/image/fetch/t_default/f_auto/q_auto/https://www.rsm.global/chile/sites/default/files/styles/subpage_hero_banner_mobile_tablet_2x/public/01%20Global%20assets/01_Banners/02_Portraiture%20banners%203840x960px/ani-02-rsm-banner-sub-page.jpg)
By: José Manuel Peña, Director RSM Chile Technology
We live in a geolocated world.
Since the 1960s, when the United States began locating its submarines using satellites, geolocation has become ubiquitous. There is no device or application that does not know where you are on the planet 24 hours a day. My phone knows better where my keys are than I do. And they also have memory to know where they have been throughout their lives.
As a result of the above, there is a vast base of geolocated information (customers, consumption, suppliers, etc.) but many companies still do not use this information in their decision-making processes.
From predicting customer behavior in the largest security provider in Latin America to assessing the layout of the largest electricity transmission project in Chile, we have seen how a good analysis of geolocated information has the potential to create value.
In this blog we present success stories using georeferenced data in AI and Analytics projects, and show how you can use this source of information in your projects.
Crossing layers of information: The context of the territory.
The value of georeferenced data is the context it provides. Used correctly, we can give context to a data/entity (a client, a piece of land, etc.) through its proximity to landmarks such as roads, cities or other layers of information ad-hoc to the problem to be solved.
For example, a client approached us with the following problem:
In a long-distance electrical transmission project, they were missing a key item to budget its cost, compensation for land use. Without going into details, this cost can be more than half of the total cost of the project and, despite being regulated, its value varies enormously between different properties in view of its use and commercial value (it is not the same to go through a wasteland than for a productive field or an industrial park).
In view of the above, the question is summarized as:
How to generate the mass appraisal of land as part of the compensation cost estimate?.
Usually this is done by appraisers in the field, but when you want to do it on a scale (hundreds or thousands of lots throughout Chile), doing it manually is prohibitive, in addition to being at the mercy of the differences in criteria of a multitude of local appraisers.
Faced with this challenge, what we sought was to replicate the attributes that are usually used in an appraisal: surface area, infrastructure, production, etc. But if we want to properly capture the value of a piece of land, we have to incorporate the "where" it is located, which in this case resulted in estimating the proximity of each piece of land to various relevant territorial landmarks such as urban areas, roads, power lines, etc.
For this we raise multiple layers of public information (zoning of the Ministry of Housing and Urbanism, electrical and road network of the Ministry of Public Works, among others) and through an ETL process (Extraction, Transformation and Loading of Data) in Python we estimate for each terrain its shortest distance to each layer, that is, the shortest distance from each terrain to a road, a city, a power line, etc. In this way, we were able to sensitize our predictive models to the "territorial attractiveness" of each piece of land in a robust way, improving the quality of the estimate.
Not everything is so easy, if the layer of information you want to cross is very extensive (such as a road), or has many specific elements (such as urban areas), the process can be extremely slow, calculating the distance of each terrain against each point of the analysis layer.
Faced with this difficulty, our strategy was “divide and conquer”, where we first split a large polygon into many sub-polygons (using algorithms like these, see “Splitting large polygons for faster intersections”), sort them into a KD Tree based on center of the polygon, and only calculate the distance for the closest subset.
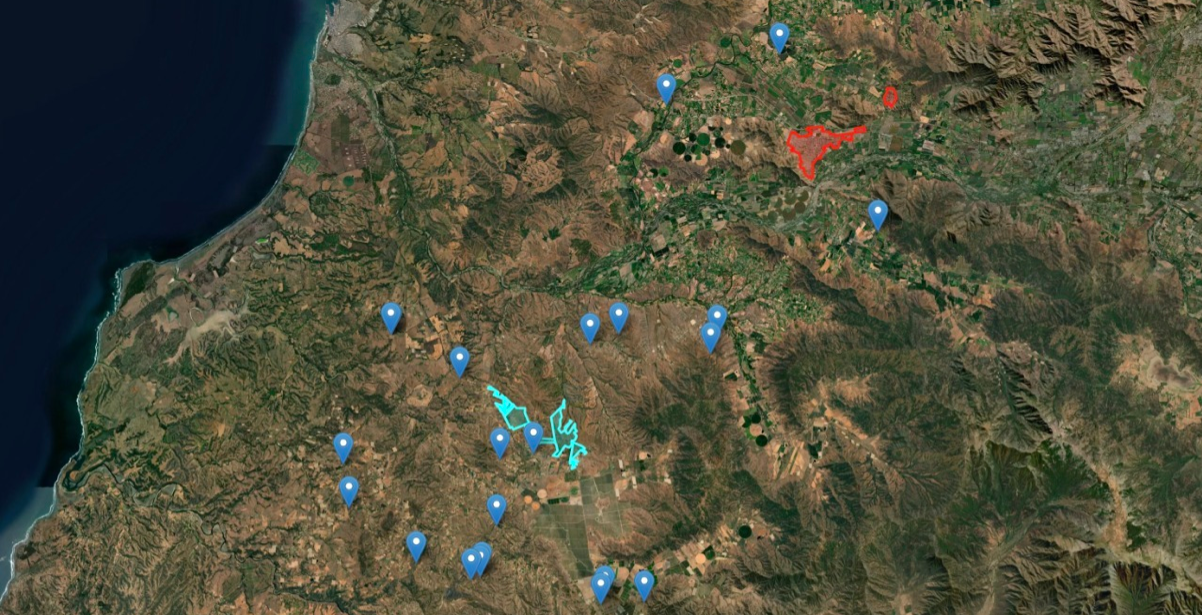
Example of land appraisal (blue dots) in the context of urban areas (colored areas) in the Melipilla, Chile.
Applying this strategy to our predictive models, we were able to generate a fast, robust and efficient appraisal process, capable of analyzing hundreds of properties quickly, without costly field trips.
And now comes the most interesting, how do we validate the results? Well, we compare them with other studies carried out manually and they were analyzed by expert appraisers who confirmed the quality of the results obtained. This allowed us to lower appraisal costs by more than three times compared to traditional processes, obtaining better, more robust and explainable results.
Given this and many other cases “LOCATION MATTERS”. This is the first of several posts on geolocation and data science, in the next post we will show other interesting use cases.
Check: