![Location Matters: Geolocation and Data Science [Part 2]](https://res.cloudinary.com/rsmglobal/image/fetch/t_default/f_auto/q_auto/https://www.rsm.global/chile/sites/default/files/01%20Global%20assets/01_Banners/02_Portraiture%20banners%203840x960px/pauline-01-rsm-banner-sub-page.jpg)
By: José Manuel Peña, Director RSM Chile Technology
Incorporating terrain into the equation.
We continue to analyze how data science can help solve problems in the territory (if you want to know more, here is the first post). In this second post, we are going to talk about how the land itself, in terms of its topography, can be used as a source of relevant information to systematically understand its potential use and value.
Intuitively, the shape and type of land obviously influences the type of uses that it can have; A piece of land located on the side of a hill or ravine is not the same as one on an esplanade. This is critical in appraisal processes or definition of the suitability of a site (electrical layout, roads, mining projects, etc.), and in the manual appraisal process it is a commonly considered factor.
The problem is that understanding the topography of a land for these purposes usually required site visits to take measurements, which is extremely expensive and time-consuming to scale up. At this point, data science comes in so that, based on digital elevation models, characterizing a terrain in terms of its topographic attributes in a massive and scalable way, allowing the incorporation of high-value contextual information to problems in an innovative way and reaching estimates with more accuracy and robustness.
Example: Analysis of Solar Energy Potential for appraisal of layouts.
In a similar case, we were presented with the challenge of estimating for a large Chilean mining company the cost of easement of a plot of land for confidential purposes , which crossed from the coast to the mountains through the "Big North" of Chile.
Although the techniques discussed above were useful to give context to each piece of property to be appraised, a key element was missing to understand their value, which was the potential of each piece of land to be a Concession for Expensive Use (CUO), that is, if could be used for solar power generation or not (which leads to a higher valuation).
In simple terms, in the northern region the solar generation capacity is one of the highest in the world, so to host a solar project you need some elements, for example:
Being close to an electrical substation to deliver the generated energy.
Have a flat surface facing the sun large enough to install the solar panels.
Between other relevant factors
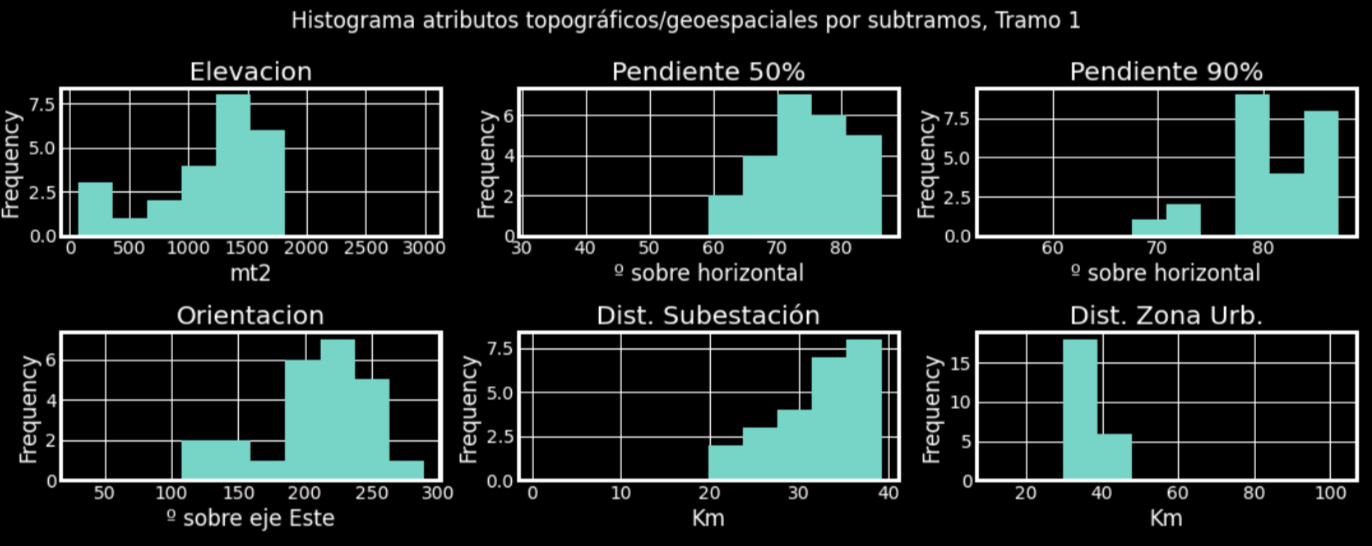
The first point was easy to solve with the techniques already discussed (the distance from each property to the nearest substation was estimated), but the second point was more difficult. How to measure the slope and orientation of each piece of land in a strip of more than 20 kilometers?
For this we had the welcome help of NASA and its satellites. Fortunately, NASA has generated a detailed (and very heavy) global digital elevation model (DEM) called NASADEM, which, with an accuracy of 30 m2, estimates the elevation of each point on earth.
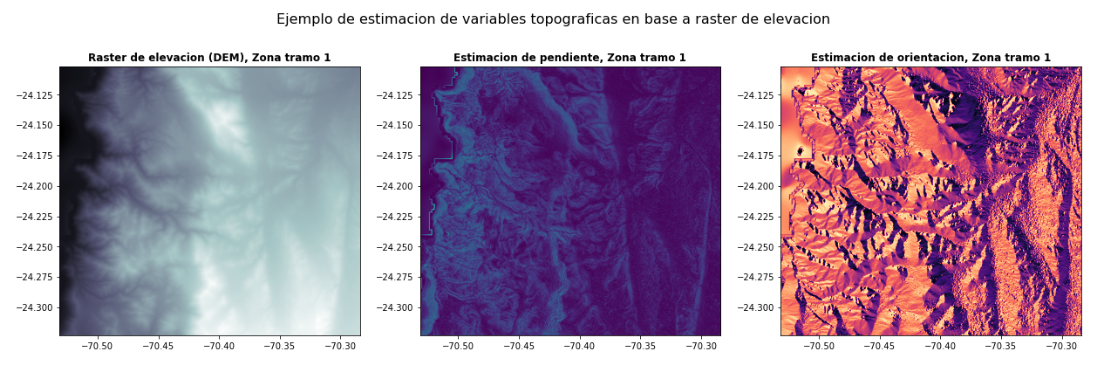 With these data, and a couple of topographic analysis packages (particularly richDEM) we were able to estimate the distribution of elevations, inclinations and orientations of each terrain and thus generate attributes such as the median and variability of inclination and orientation of each terrain.
With which we were able to generate predictions of solar generation potential with over 80% accuracy.
Example: Using satellite image analysis to generate relevant attributes - Land Use [LU] or Land Cover [LC].
Land cover classification using remote sensing data is the task of classifying pixels or objects whose spectral characteristics are similar and classifying them as forests, grasslands, wetlands, arid lands, cultivated lands, and built-up areas. Various techniques have been applied to land cover classification, including statistical algorithms and recent machine learning approaches.
This has been done using traditional imaging in some cases and hyperspectral imaging (HSI).
Hyperspectral Imaging (HSI) is an important technique in remote sensing, which collects the electromagnetic spectrum ranging from the visible wavelength to the near infrared. Hyperspectral imaging sensors often provide hundreds of narrow spectral bands from the same area on the earth's surface. In hyperspectral imaging (HSI), each pixel can be considered as a high-dimensional vector whose inputs correspond to the spectral reflectance at a specific wavelength.
This allows us to obtain relevant attributes when building our models, such as if a zone is:
| Clases | Description |
|---|---|
| Arid lands | Terrain that don´´'t have vegetarion or buildings. |
| Buildings | All non residential buildings |
| Residential buildings | Residential buildings |
| Roads | All roads, asphalt, dirt, bridges, among others. |
| Forest | Forest or intense vegetation |
| Wetlands | Rivers, lakes seas and other water bodies. |
Using data science models, in conjunction with rich data sources, work can be done that would have been unthinkable in other times, imagine 20 years to be able to calculate the slope of a land in a layout of more than 1000 km, anyone would say IMPOSSIBLE, today with these tools it can be done efficiently and effectively.
Given this and many other cases “LOCATION MATTER”. In this and future posts we are going to continue reviewing opportunities and definitions that we have addressed to effectively incorporate this important, but commonly overlooked, dimension of all processes in the territory. In the following article on geolocation and data science we will talk about how to use geolocated data to predict the churn of your customers.
![Location Matters: Geolocation and Data Science [Part 2]](https://res.cloudinary.com/rsmglobal/image/fetch/t_default/f_auto/q_auto/https://www.rsm.global/chile/sites/default/files/styles/crop_thumbnail/public/media/Jose%20Argomedo%20Perfil%203.jpg)