
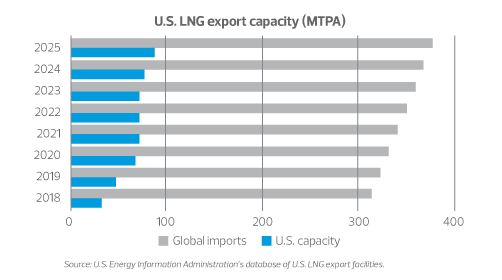
The last decade has seen enormous developments in the trade of liquefied natural gas. In 2018, the global LNG market more than tripled from the volumes seen in 2000 and grew at an annual rate of 8.3% to 313.8 million metric tons per year. Last year, there were 42 countries importing LNG compared to only 18 countries in 2008.1
In the United States, the surplus of natural gas (primarily in the Appalachian region) has helped the country become a net exporter of natural gas. With key infrastructure developments in the Gulf Coast area, the U.S. LNG export capacity is expected to more than double by 2020. In 2019, approximately 25 million metric tons per annum of new global liquefaction capacity is expected to come online; 21 MT of capacity is located in the United States.
The United States is positioned to play a significant role in the future of the LNG industry. As demand for natural gas is expected to grow, the timely development of infrastructure and optimal capital markets will be key for middle market U.S. gas producers.
THE CHANGING LNG LANDSCAPE
LNG is natural gas that has been liquefied to -260°F and reduced in volume approximately 600 times. LNG predominantly contains methane and generally contains ethane. Natural gas is processed at liquefaction plants near key transportation points. As of Dec. 31, 2018, there were seven operating liquefaction facilities (also referred as trains) in the United States with a total nameplate capacity of over 32 metric tons per annum (~4.6 billion cubic feet per day) compared to the global liquefaction capacity of approximately 406 MTPA. The top five LNG exporters in 2018 were Qatar (24.5%), Australia (21.2%), Malaysia (7.9%), United States (6.6%) and Nigeria (6.3%).2
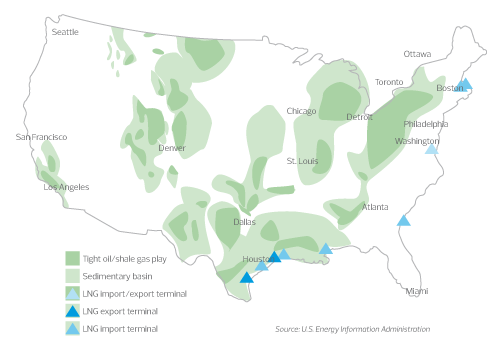
Approximately $200 billion in projects across the world are competing to provide the 65 MT of additional LNG per year that are needed by 2025. The United States has fifteen trains under construction or commissioned in the Gulf Coast area with a total capacity of 65 MTPA (~8.6 bcf/d), and has proposed seven additional projects to regulators. Mozambique, Russia and Canada are among other countries that have proposed major LNG developments that will enter the global supply battle in the coming years.
In its July 2019 Short-Term Energy Outlook, the U.S. Energy Information Administration (EIA) expects U.S. LNG exports to increase by 63% to 4.8 bcf/d in 2019 and by 42% to 6.9 bcf/d in 2020, as three new liquefaction projects come online. EIA forecasts that U.S. LNG export capacity will increase by almost 50% by the end of 2019 to 6.3 bcf/d baseload capacity as the new trains at Corpus Christi, Cameron, Freeport and Elba Island LNG are commissioned, making U.S. LNG export capacity the third-largest in the world behind Australia and Qatar.3 By 2021, six U.S. liquefaction projects are expected to be fully operational. Another two new U.S. liquefaction projects (Golden Pass in Texas and Calcasieu Pass in Louisiana) that were started this year are expected to come online by 2025. By that time, EIA projects that the United States will have the world’s largest LNG export capacity, surpassing both Qatar and Australia.4
Due to the high risk involved in financing large infrastructure projects, projects in the United States are more attractive than in other parts of the world. Some companies have explored building small floating liquefaction terminals; however, large-scale facilities are more economical in the long term.
LNG is transported by specially insulated vessels, which take approximately two years to develop and require significant capital commitments. At the end of 2018, there were 563 vessels worldwide and 138 vessels ordered and under construction, indicating the global LNG carrier fleet to increase by 25% in 2020.
LNG is regasified by increasing its temperature at its destination. In 2018, the top five LNG importers were Japan (26.3%), China (17.2%), South Korea (14.0%), India (7.1%) and Taiwan (5.4%).5¹ Countries in Asia have opted for cleaner sources of energy and have set the stage for the near-term demand for LNG. Shell projects 70% growth in energy demand by 2035, with gas supplying more than 40% of the additional demand.6
New LNG supply volumes racing to provide natural gas to the Asian markets face infrastructure development challenges. When gas prices in the future are higher than current prices (a situation referred to as contango), producers are motivated to store LNG and wait for prices to increase. While new technologies have been developed to allow vessels to store LNG for periods of time, the evaporation that occurs as well as the daily vessel rates charged make LNG storage uneconomical beyond 30 days in the current environment. Vessels have the flexibility to detour to locations where gas prices are more favorable, but most LNG has a fixed destination based upon a long-term supply agreement.
The price of LNG
Commodities around the world trade by using established benchmarks. In the United States, oil commonly trades using the West Texas Intermediate (WTI) benchmark, and natural gas commonly trades using the Henry Hub benchmark. There are now at least six derivative contracts for LNG worldwide. The most established is the Platts Japan/Korea Marker (JKM), for which trading volumes quadrupled in 2017. JKM reflects the monthly average of cargoes delivered into Japan, South Korea, China and Taiwan.
A major challenge for U.S. gas producers is the uncertainty and volatility of gas prices. The JKM has almost no correlation to the Henry Hub benchmark; when LNG spot prices are low, Henry Hub contracts are “out of the money,” and producers incur losses from these contracts.
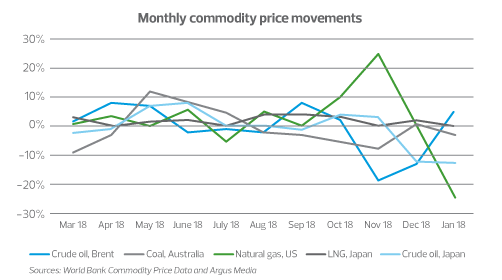
LNG traders rely on commodity derivative contracts to hedge their positions from price movements that could adversely affect expected cash flows. In April 2019, Tokyo Gas Ltd. and Shell Eastern Trading (Pte) Ltd. agreed to use an innovative pricing formula based on coal indexation. Other LNG companies have agreed to use the North Sea’s Brent crude oil prices as benchmarks for LNG. As more hybrid non-oil indexed volumes are traded, the industry will become more innovative and begin to take advantage of the technological applications available in capital markets. Transparent and reliable pricing benchmarks for LNG and flexible commercial arrangements will be key to achieving efficient trading mechanisms.
Challenges and opportunities for U.S. middle market energy companies
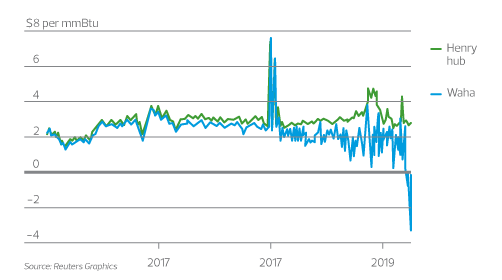
Most oil and gas reserves have a mix of oil, natural gas, natural gas liquids and water. Upstream companies need to be able to sell or use these components in order to make projects economical. An increase in oil prices generally puts downward pressure on gas prices as the increase in oil production is accompanied by natural gas byproducts. An issue for upstream companies in the recent years has been inadequate levels of takeaway capacity, which is the pipeline infrastructure available to transport products out of the basin. When production levels increase, and pipeline utilization is high, the gas competes with product from other basins due to the limited pipeline capacity—thereby decreasing the spread between the basin price to the benchmark. Once the basin price approximates the benchmark, producers could be “out of the money” on the gas sold. In the Permian, there has not been enough takeaway capacity and prices at Waha Hub have traded at record negatives. Producers are allowed to burn gas to a certain extent and, without buying agreements in place, can be forced to sell at a loss.
The need for takeaway capacity and the expected growth in LNG export capacity have signaled midstream companies to develop infrastructure from West Texas to the Gulf Coast. Not only is Texas projected to have major LNG exporting capacity, it also offers certainty regarding the regulatory environment. In the Appalachian region, upstream and midstream companies benefited from the development of Maryland’s Cove Point LNG terminal last year. Although Appalachia is rich in natural gas resources, there are no LNG projects under construction in the northeast and takeaway capacity will continue to be an issue in the region.
As midstream projects come online in Texas, producers in the Permian and Eagle Ford will have increased certainty on realized margins on natural gas. Some experts have projected excess takeaway capacity in Texas in the near-term, followed by a shortage takeaway capacity in the long term. Given the cyclicality of the supply chain of natural gas, upstream and midstream companies will continue to focus on planning developments according with supply and demand factors.
The trade of LNG is nowhere near as developed as the market for crude oil, and there has been a high concentration of few large LNG producers in the world. Accordingly, the LNG space has not seen a lot of merger and acquisition activity. Although many middle market energy players are increasingly interested in entering the LNG space, the increasing number of barriers to entry continue to limit the number of companies in this space. Collaboration, innovation and flexibility will determine the long-term success for U.S. middle market energy companies.
Sources:
1 “The LNG Industry Annual Report 2019” (April 2019) International Group of LNG Importers.
2 Ibid.
3 Short-Term Energy Outlook July 2019. U.S. Department of Energy, Energy Information Administration.[1] “Short-Term Energy Outlook July 2019,” U.S. Department of Energy, Energy Information Administration.
4 U.S. Department of Energy, Energy Information Administration, Today in Energy (2019, July 29). U.S. LNG exports to Europe increase amid declining demand and spot LNG prices in Asia.
5 “The LNG Industry Annual Report 2019” (April 2019) International Group of LNG Importers.
6 Shell LNG Outlook 2019, shell.com.